The SAND/USD chart shows a strong rebound from the $2.76 low, with a 72 percent return on investment. The rally, nevertheless, was unable to break through the falling trendline and was rebuffed at the next support level of $4.1. If bears maintain their position below, selling pressure will increase, and the token will fall to $3.5.
SAND
SAND is a utility coin that serves as the foundation for all activities and engagements in The Sandbox community. It’s an Ethereum blockchain-based ERC-20 utility coin. The availability of 3B SAND is limited. SANDs awarded to founders and advisors also have a five-year retention period and a twelve-month cliff. Gamers use SAND to purchase products from the market, develop games, play games, and modify their avatar characters.
SAND will enable holders to engage in platform governance choices using a decentralized autonomous organization framework going live in the second quarter of 2022. SAND could be staked to receive a share of the proceeds from land sales. The Sandbox Foundation provides funding to the Sandbox environment. There has been a massive increase in demand for SAND since October last year.
Investors of Sand Lost Their 20-Day SMA Support
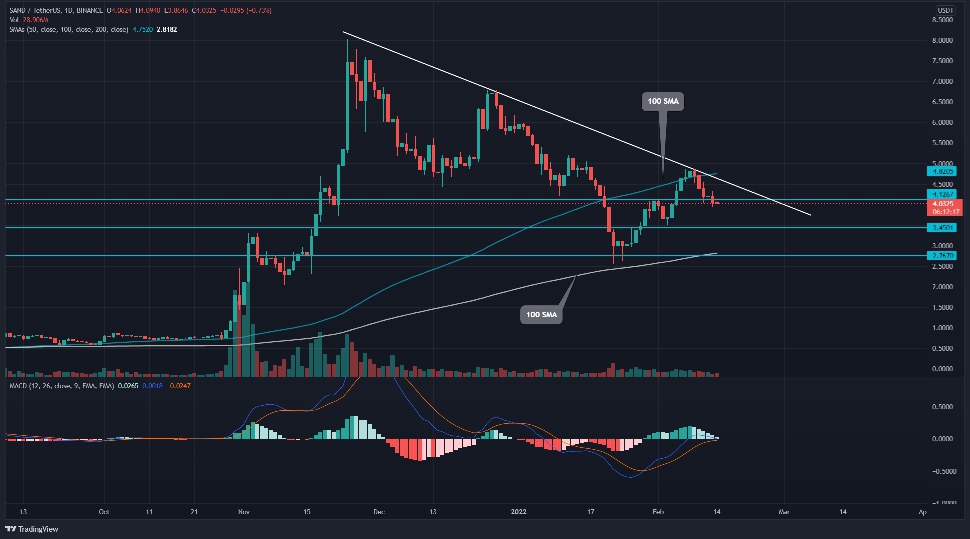
SAND/TetherUS SMAs. Source: TradingView
The SAND/USD purchasers extended their rebound in February and climbed to the $4.8 mark. Nevertheless, at this point, a convergence of multiple key levels, including the declining trendline, 50 and 100 DMA, posed strong opposition, reverting the altcoin underneath the nearest support of $4.1. The token’s current valuation of $4.03 represents a 15.5 percent drop from last week’s pricing. If the selling continues, the altcoin might be dragged to $3.5 or 2.76 support, showing that bears are trading on rallies.
The rapid and sluggish lines on the daily-MACD signal have failed to move above the neutral line (0.0). A negative crossing between these lines indicates a sales forecast for cryptocurrency traders. The down-sloping 50-SMA accentuates the bears’ strong selling. Furthermore, the token price falls below the 20-SMA, giving short-sellers an extra advantage.
Minor Pullback From Declining Trendline
The current retracement follows a declining trendline to keep the downward trend going. The price of SAND would keep falling until this critical barrier holds. The SAND/USD technical chart indicates lesser value resistance to the daily candlestick, implying that buyers attempt to protect the $4 psychological threshold. If the investors are successful, the pair will rise above the falling threshold and test the resistance threshold again.
$3.8 and $4.4 are the resistance levels.
$3.3 and $2.7 are the support levels.